Aral Sea – A Chronicle
Course: Interactive Communication Systems I Project date: Winter 2016 Team: Vanessa BoutzikoudiMartin WehlKai Magnus MüllerGoal
Section titled GoalThe course Interactive Communication Systems I aims to provide a look into exhibition design. After initial research into multiple topics, we were expected to choose one and present it to a user group of our choice. With this project we wanted to educate children in school and their parents in an exhibition setting about the causes and solutions to the sea’s condition.
A Man-Made Disaster
Section titled A Man-Made DisasterThe Aral Sea between Kazakhstan and Uzbekistan was formerly one of the four largest lakes in the world. In the early 20th century the Soviet government decided to irrigate the desert and grow rice, melons and cotton. The remaining water flowing into the Aral Sea could not match losses through evaporation and the sea began to shrink. By 1960 between 20km2 and 60km2 of water was diverted each year. In the 1970s the Aral Seas level fell by 50-60cm each year. By 2009 only its northern part and a small strip in the south remained.
The process of drying up the sea has left plains covered with salt and chemicals from weapon testing and industry, pesticides and fertilizer. The region’s fishing industry has been devastated which caused rising unemployment. Dust storms are blowing toxic sand into settlements, causing serious public health issues.
Introduction
Section titled IntroductionWe wanted to raise awareness of this issue with our project as the Aral Sea has largely been ignored in the public. We wanted to show the process of drying up that happened over multiple decades from the 1960s until today.
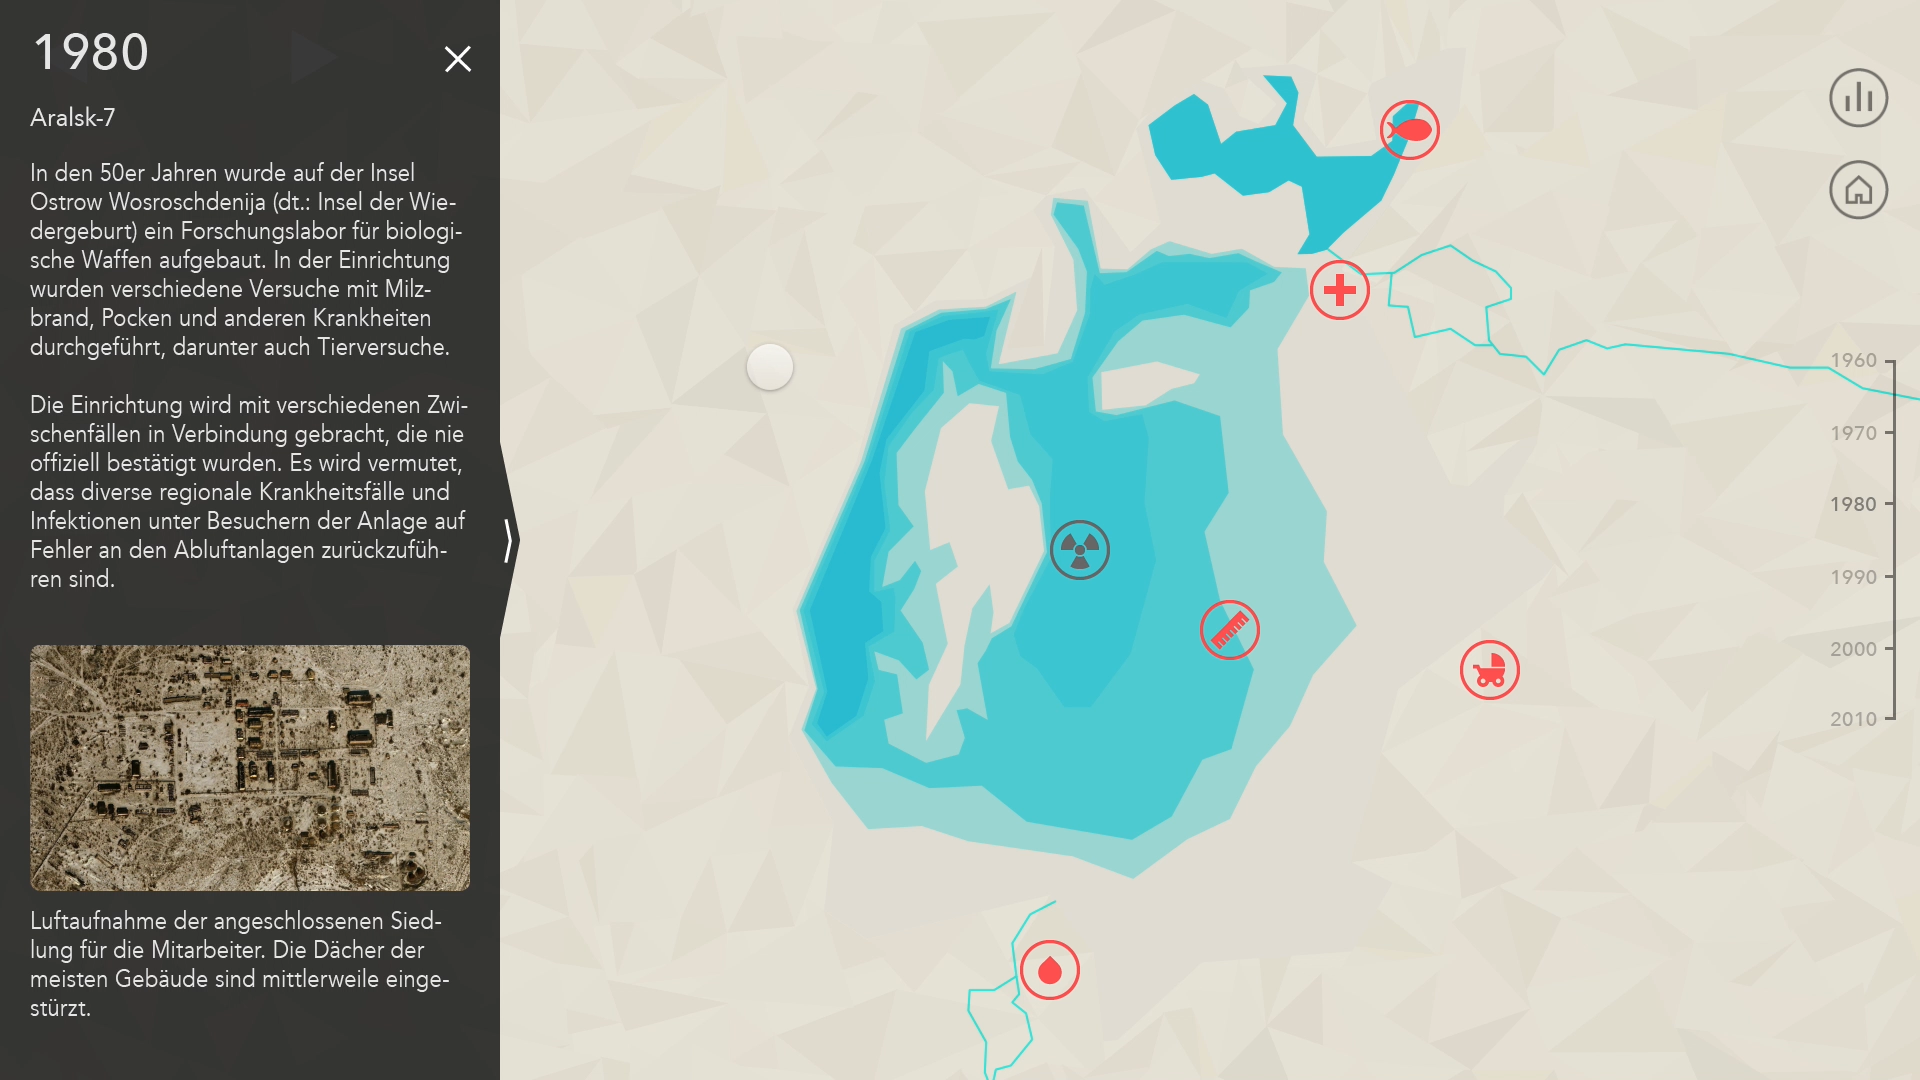
A central map of the Aral sea and it’s surroundings shows the decreasing surface area. While navigating through the decades, users can access „hotspots“ around the map and see where and when events occurred. The causes and events around the drying and its influences on the population are presented in diverse and engaging media textually and visually.
The user can navigate through the decades and watch the Aral Sea shrink based on historical records. Each year has different hotspots placed on the map (some are missing in this video).
Hotspots
Section titled HotspotsFor each decade we gathered information and summarized them for our users. We present them not only in the relevant time period but also at the position they were happening. Users can activate those red spots, which we call “hotspots”, by touching the screen.
We decided to use hotspots as our means of conveying information to let our users play with the available information. Separate decades give a loose chronological separation while the hotspots have no clear order. Users are free to explore different topics at their own pace. Already read spots are greyed out to prevent confusion.
Physical Interaction
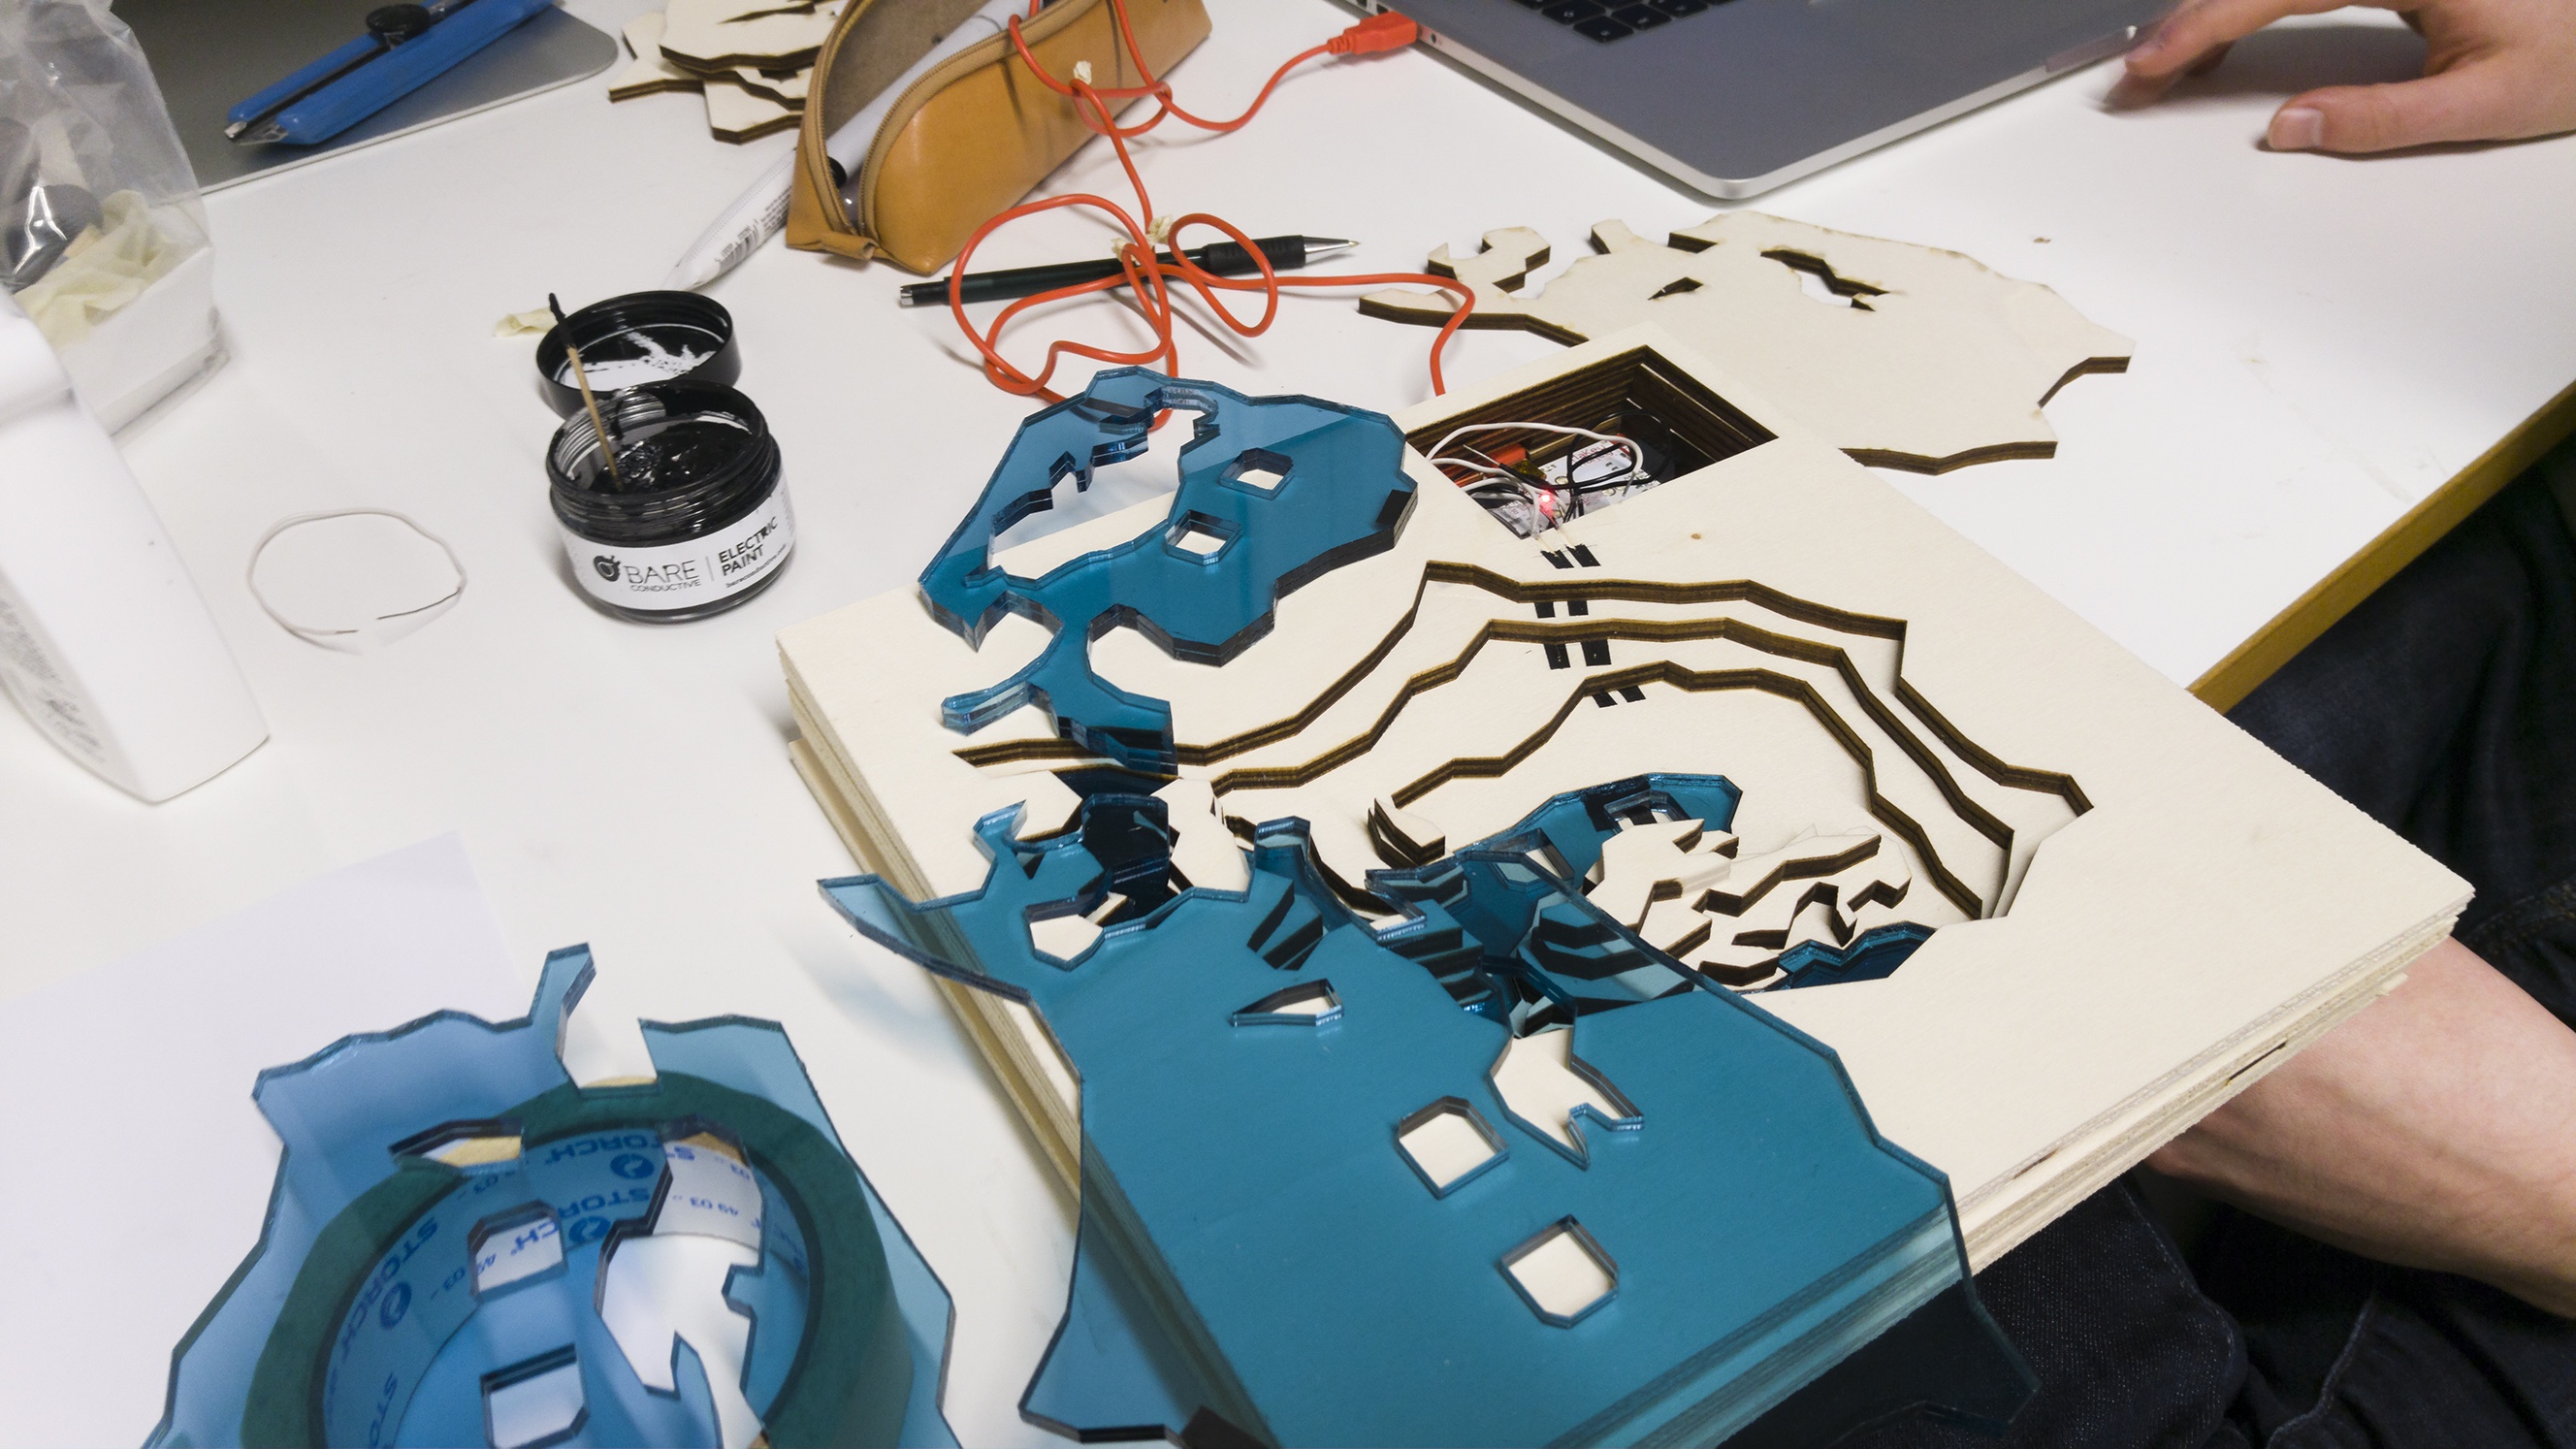
Section titled Physical InteractionTo navigate through the decades, we built a physical model where the user takes acrylic sheets out of the sea and can figuratively drain the sea themselves. The model acts to draw the attention of visitors at an exhibition towards our exhibit. Functionality-wise, it offers a natural way of navigating through time. The acrylic sheets are laser cut to represent the shorelines of every decade from 1960 onwards.
Outlook
Section titled OutlookDespite the dire situation, the Kazakh government has made effort to restore the North Aral Sea in recent years. The Kok-Aral dam was completed in 2005 and almost completely restored the northern Aral Sea. Uzbekistan has made no efforts towards restoring the sea and continues to divert water thus the southern part remains desert.
Process and Technology
Section titled Process and TechnologyAs the first major group project, this project taught us a lot about coordination, discussing problems and reaching agreements as a team. After initial research we created an information architecture and started with sketches and prototypes on paper. Once that part was developed far enough we started doing screen design and continued to iterate.
My focus in this project was on designing and lay-outing hotspots and parts of the statistics with Illustrator and creating our prototype with Framer Studio. We decided to use Framer because its JavaScript (CoffeeScript to be precise) foundations allow for more flexible custom inputs via keyboard.
About
Section titled AboutThis is a student project created during winter semester 2016 together with Vanessa Boutzikoudi and Martin Wehl. The course Interactive Communication Systems I was led by Bernadett Ritter.
Our project was featured at bareconductive.com and was awarded with the Digital Talents Award from the Annual Multimedia Awards 2018.
View it at hfg-gmuend.de.